Electricity Consumption and Energy Efficiency Metrics (FY 2025):
The electricity consumption in higher education institutions has become a critical issue in the context of global efforts toward sustainability and climate change mitigation. Universities function as complex organizations with diverse energy demands arising from academic buildings, laboratories, libraries, student dormitories, administrative offices, and recreational facilities. As a result, the level of electricity use in universities is typically substantial and continues to increase in line with institutional expansion, technological advancement and the growing use of energi intensive equipment. The electricity consumption in our university in 2025 was description as a information below;
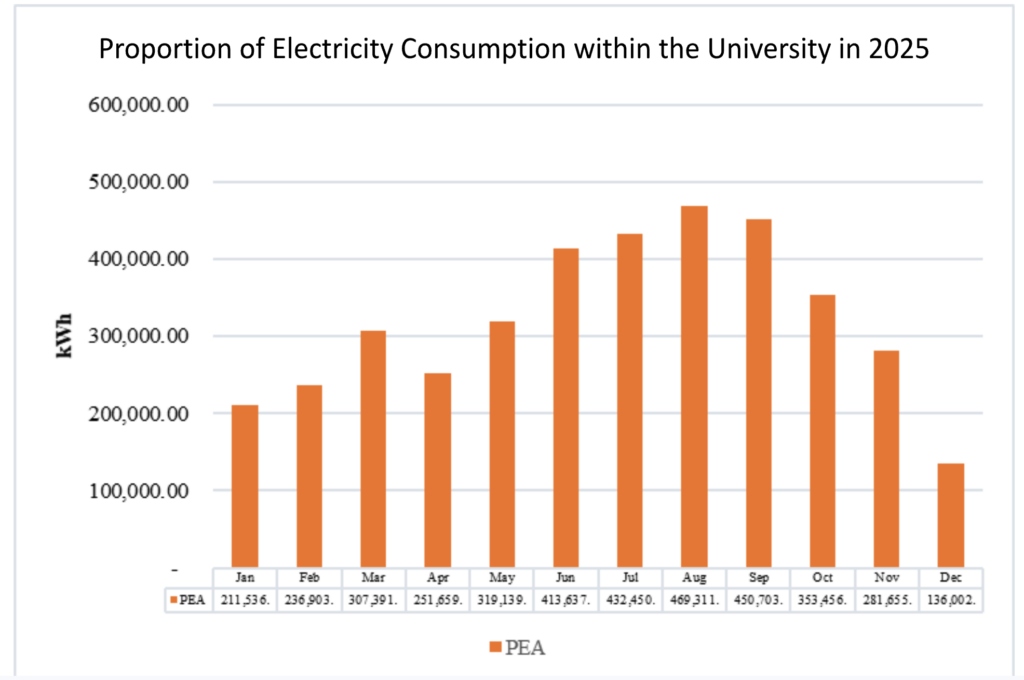
The bar chart illustrates the monthly electricity consumption of the university throughout the year 2025 (B.E. 2568), measured in kilowatt per hours (kW/h). The data show a clear seasonal variation in energy demand across the year. Then, the electricity consumption begins at 211,536 kW/h in January, gradually increases in the first quarter and reaches 307,391 kW/h in March. Furthermore, a slight decline is observed in April (251,659 kW/h) before rising steadily from May onward from June to September, according to the consumption remains at its highest level, peaking in August at 469,311 kW/h, followed closely by September at 450,703 kW/h. After September, electricity usage gradually declines, dropping to 353,456 kW/h in October around 281,655 kW/h in November and reaching the lowest value in December at 136,002 kW/h. Hence, the data indicate that electricity consumption is highest during the mid year period (June–September), which may be associated with increased campus activity and seasonal climatic conditions, while the lowest consumption occurs at the end of the year.
Sakon Nakhon Rajabhat University (SNRU) demonstrates a structured, significant impact on the United Nations Sustainable Development Goals (SDGs) through its diverse portfolio of education, research, and community outreach programs. As documented in the university’s institutional reporting and performance showcases, the curriculum and academic initiatives directly support at least 6 to 7 distinct SDGs: This comprehensive […]
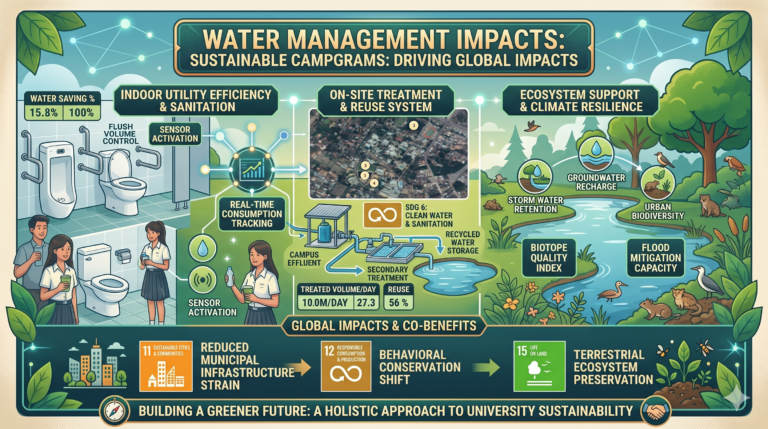
Integrated Impact of Water Management Programs on the SDGs The university’s water management initiatives are driven by a holistic framework. While centered around clean water infrastructure, the program generates cross-cutting impacts that simultaneously support four distinct Sustainable Development Goals (SDGs): [ SDG 6: Clean Water ] │ ┌────────────────────────┼────────────────────────┐ ▼ ▼ ▼ […]
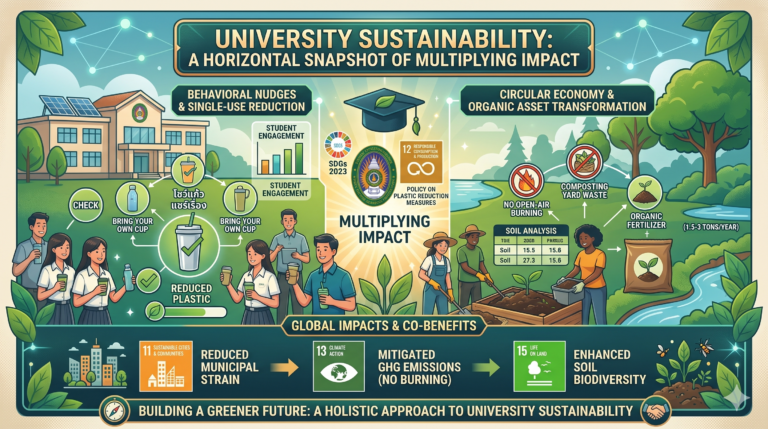
Integrated Impact of Waste Management Programs on the Sustainable Development Goals (SDGs) While the university’s baseline framework originates from SDG 12: Responsible Consumption and Production, the operational practices executed by the Buildings and Vehicles Ground Division demonstrate a powerful, systemic impact that cuts across multiple global goals. ♻️ SDG 12: Responsible Consumption and Production (Core […]